Dashboards
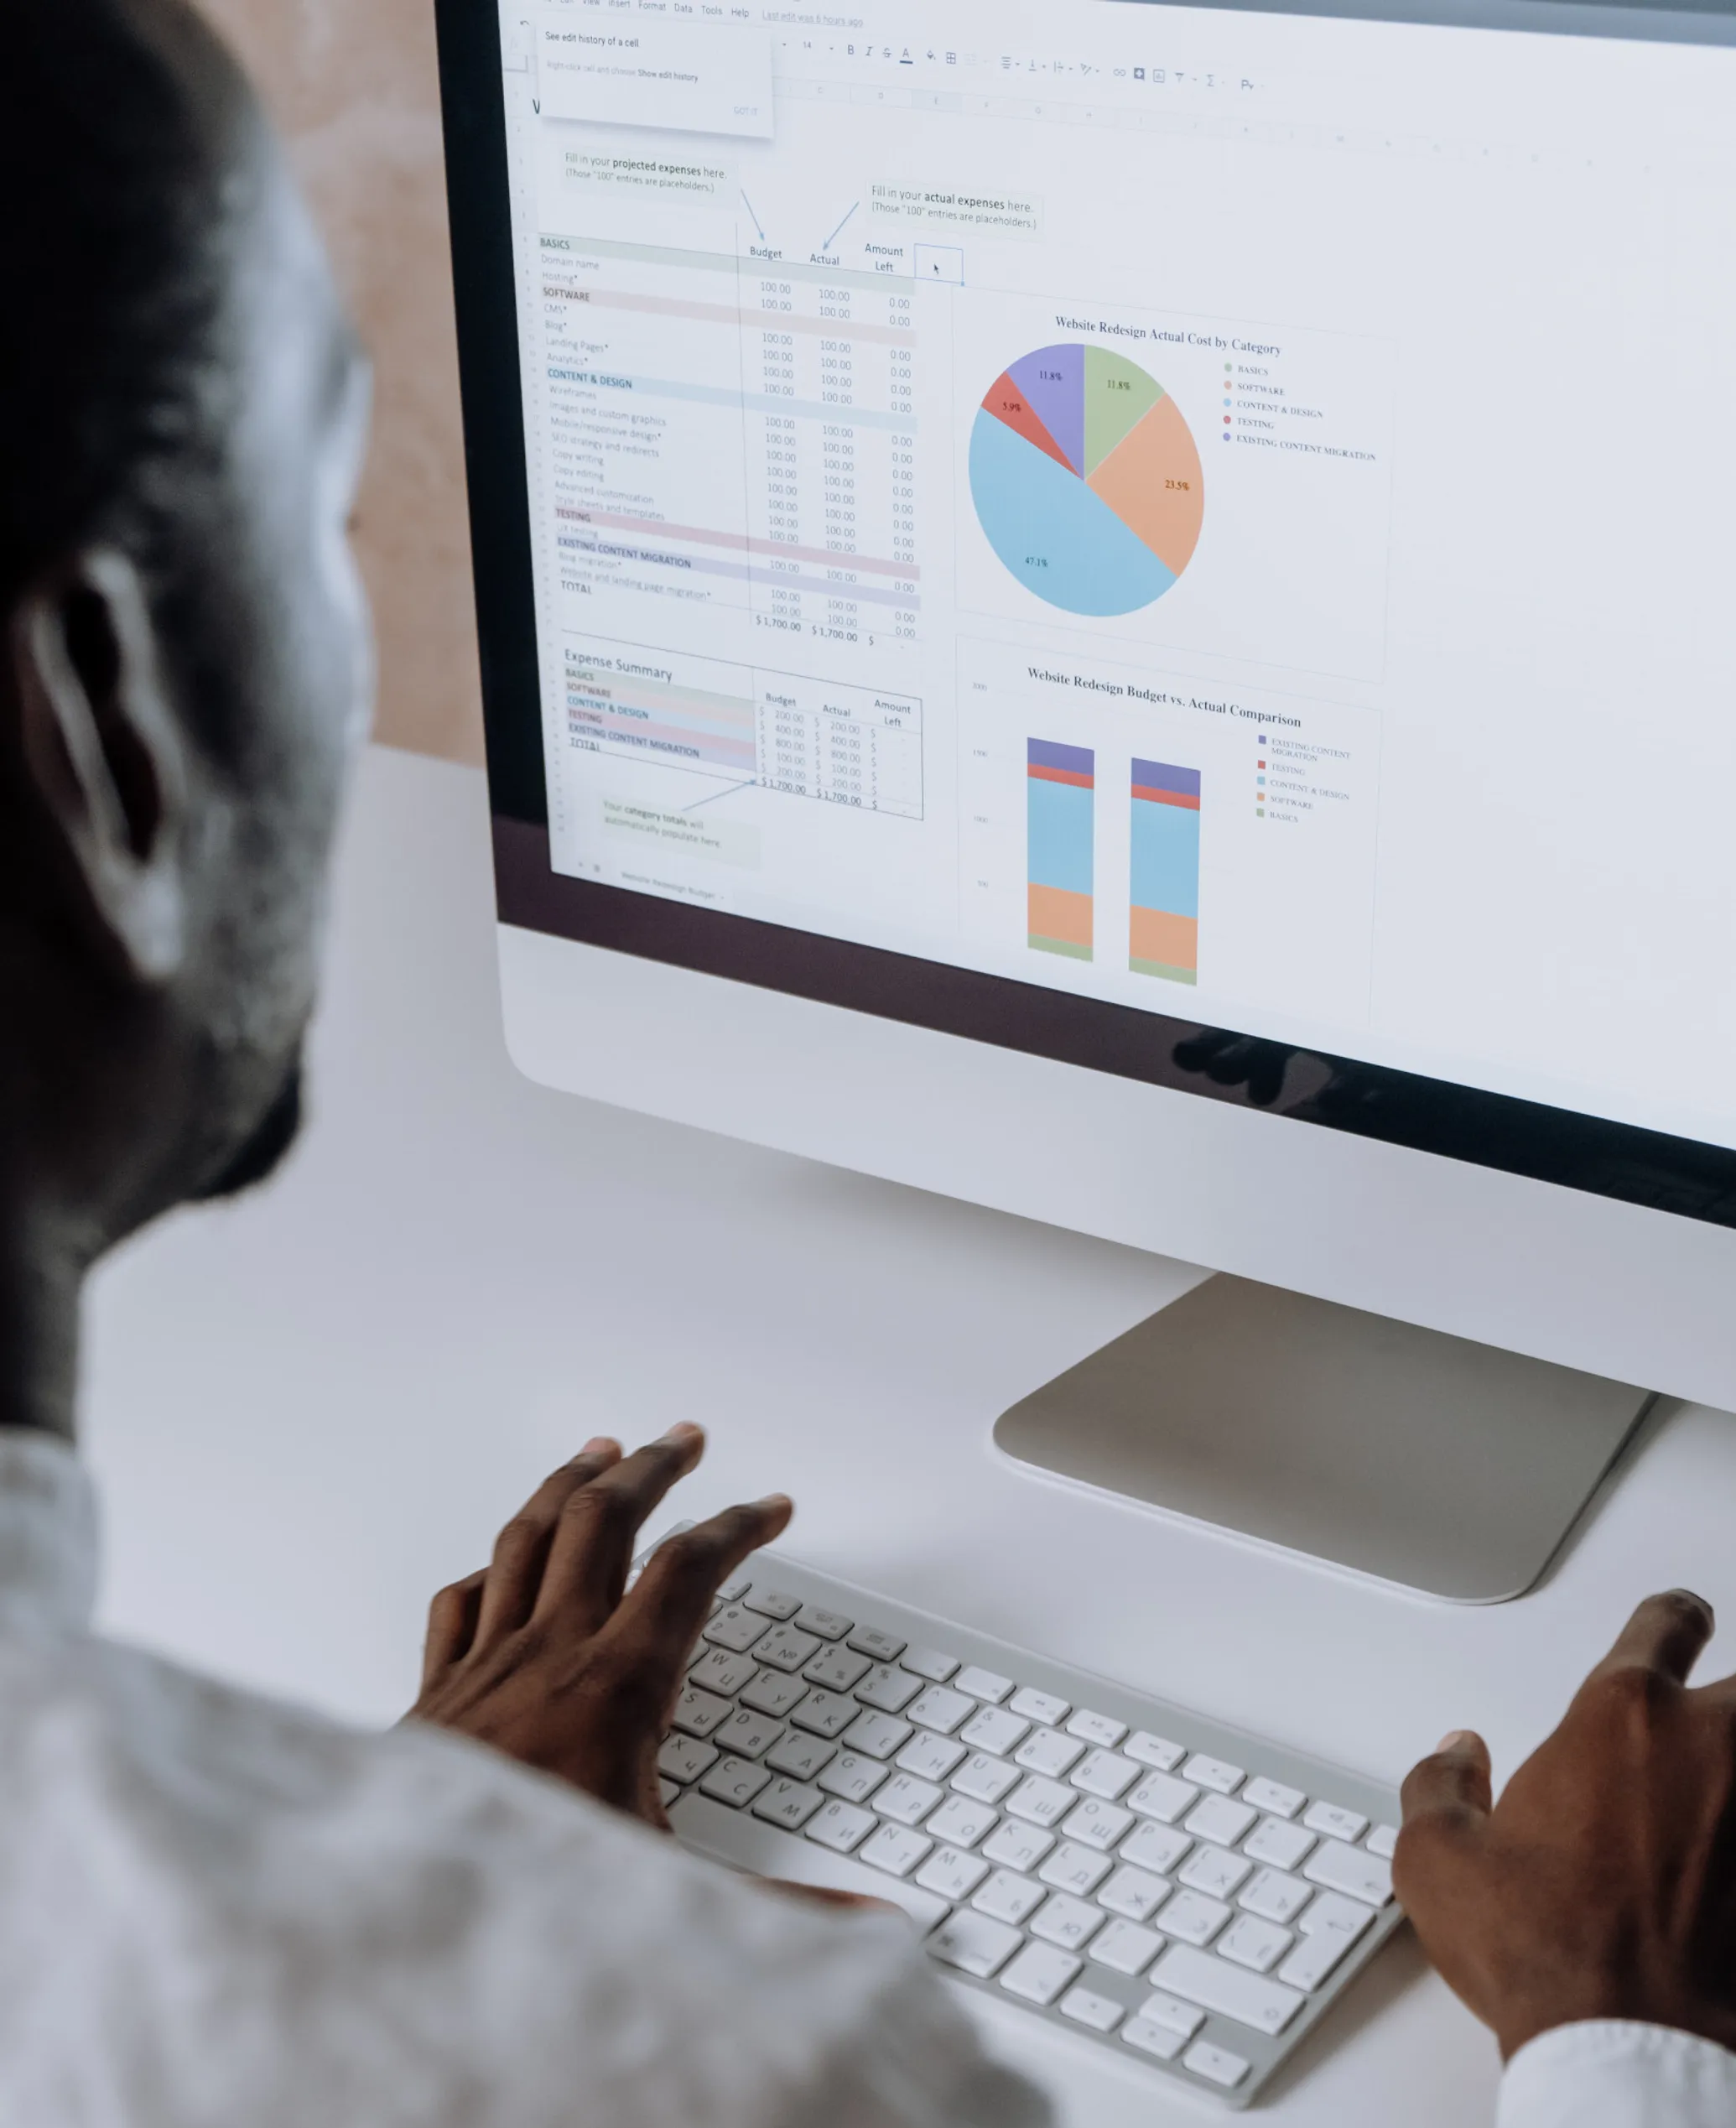
From common data formations and models, dashboards deliver important information succinctly. All dashboards feature pie charts, graphs and tables that can be arranged and customized for each user's particular need.
The most common setup is for an auditor to track progress on many different tasks simultaneously, allowing him or her to visually assess one's progress. Additionally, dashboards can be setup for other users such as clients and coders to be able to communicate the entire auditing process more efficiently.
Any particular questions or inquiries? We'd like to hear from you.
